2022-10-25

Obscure Local History #9: William Marvy Eats 14 Coneys in 1926

[The Marvy Company c. 1984.]

William Marvy is one of the greatest inventors in St. Paul history, and his barber supply factory still sits on St. Clair Avenue churning out rotating barber poles. But it's a little known fact that he also liked coney dogs.

(Crossover alert!)

Here's an excerpt from the delightful book, The William Marvy Company of St Paul, all about the history of Marvy and his incredibly rotating barber pole, describing Marvy as a young teen with a head full of ideas:

Bill had one foot in the adult world of sales but was still a sixteen-year-old kid. On February 2, 1926, he 'bet Mr. Deutsch I could eat 14 Coney Islands in less than 40 minutes. I won the bet by eating 14 in 22 minutes.'

That long ago, he probably got them from the Original Coney Island on St. Peter Street! 

2022-10-14

Twin City Sidewalk Vendors #6


[University Avenue, St. Paul.]

[Mendota Heights. File photo, author at right.]

[Payne Avenue, St. Paul.]

[Payne Avenue, St. Paul.]

[Frogtown, St. Paul.]

[Como Avenue, St. Paul.]

[Concord, OH.]

[Location forgotten.]

[Mendota Heights. File photo, author's sister at center.]

2022-09-09

Twin City Street Musicians #23

 
[Tokyo, Japan.]


[Lowertown, Saint Paul.]


[Union Depot, Saint Paul.]


[Summit Avenue, Saint Paul.]


[Mississippi River, Saint Paul.]


[West 7th Street, Saint Paul.]


[Downtown, Saint Paul.]


[Downtown, Saint Paul.]


[Grand Avenue, Saint Paul.]

2022-08-30

No, Housing Starts in St. Paul are Not Up Over the Last Year

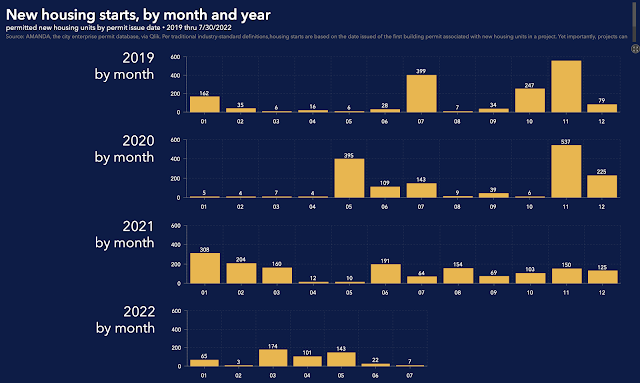
[DSI permit numbers, from the Open Data portal.]

I wasn’t there, but according to both Fred Melo at the Pioneer Press and Max Nestarak at the Minnesota Reformer, there was a weird moment at last week's City Council public hearing, where the Department of Safety and Inspections (DSI) gave an overview of the rent control measure. Somewhat shockingly, they announced that housing permits had gone up since the ballot measure had taken effect, that city-wide housing construction in 2022 was higher than the year before. As Melo pointed out, this flies in the face of data from the national HUD database that has long tracked housing starts for every city and county in the nation, the data I’ve been using to crunch similar numbers. 

(It's especially weird because HUD gets their data from each city and county, which reports it monthly. The discrepancy probably points to some internal problem at City Hall.)

Since the meeting, I put in a data request to the City to find out more precise information about the housing starts. So far, the response I've gotten (the same as the ones published by Nestarak and Melo) hasn't been that helpful. DSI cites its already published chart, and referred me to the city's Open Data portal, which has the same DSI data as its source.

[Even I know this is bad number crunching.]

So what's going on? 

As DSI Director Angie Weise points out, one key distinction here is a difference in data. DSI is using building permit applications (i.e. a developer starts the process of approval) versus HUD, which is using housing starts (i.e. a developer has successfully received an approved permit from the city and is beginning construction). 

This is a key distinction for a few reasons. First, there’s often a significant time lag involved. A permit application might take a few months to half a year to be processed, before it finally goes through, if it ever does. Sometimes projects can be delayed for years, or it might get cancelled for a whole bunch of different reasons, including a loss of financing. For example, years ago on the Planning Commission, I remember approving a great 97-unit affordable housing building at Marshall and Fry. Today, the site remains a surface parking lot. The way I understand it, that project would show up in the DSI statistics, but the homes don't exist.

If you want another great example of why permit applications are misleading, look at the controversial Lexington Parkway Alatus mixed-use development, an extreme case of why permits are misleading. It’s a long story, but the housing project was first proposed (i.e. a permit was applied for) back in 2019. It went through the process at least two times, and if I understand correctly what the DSI data shows, the 250-300 units of housing from the Alatus project would have shown up more than once in the DSI official count.

[Hopefully, the final rendering.]
It’s still a vacant lot today, but one of the developers recently announced they had finalized financing (somehow, yay!) and have officially acquired the site, likely to become a 300-unit apartment building. For the current iteration of the Lexington Parkway / Alatus, the building permit has still not been entered into the permit data, but will be at some point soon. (Maybe in six months?) 

At that point it will go into the approval process for what's likely to be a few months. Only after it’s approved will it become a “housing start,” probably a year away. This is why, in general, housing starts are a more accurate tool to measure the housing construction for a city, and why the HUD data more useful, especially for inter-city comparisons.

The second big problem with the DSI chart is pretty obvious, even if you stick to their own data. Whoever put the chart together did not use year-long housing permit data, but only compared the first six months of the year. If you glance at the DSI Open Data portal chart, you see why that’s a problem.

For some reasons, probably through a coincidence or fluke, since 2018, the largest housing permit numbers have appeared in the second half of the calendar year. (See chart at the top of this post.) I am not aware of any reason for this, but that’s what happens in the DSI data. 

How you want to measure the effects of rent control depends on when you think it first impacted financing: when it was first put onto the ballot (June 2021), voted on (November 2021), or was officially enacted (May 2022). But even glancing at these data, you can see the decline. I haven't crunched the numbers but I'd guess it's between 25% to 50%.

Meanwhile, my most recent update from July HUD housing starts shows a YoY decline of 80% for a full year, and 60% since November. By contrast, Minneapolis housing starts are up over 200%.

Anyway, there’s more to come. I'd still like to split out market-rate versus subsidized housing construction, and get to the bottom of St. Paul's data discrepancies. 

But at the very least, I don’t think DSI did a good job giving the City Council useful information about St. Paul housing trends. Hopefully the city can move past this, and we can get a new construction exemption on the books that will incentivize broad investment in housing in St. Paul.
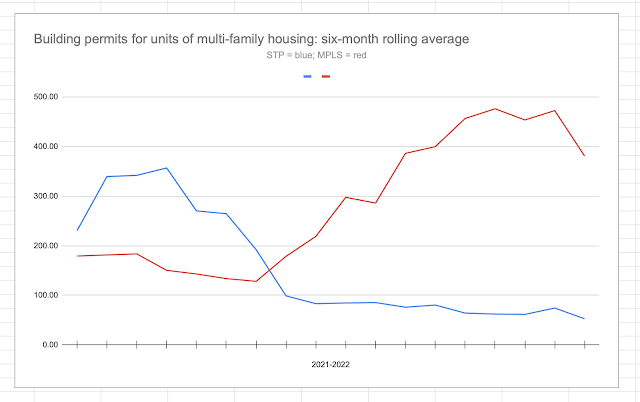
[This remains a more accurate look at housing in Minneapolis and St. Paul.]


2022-08-26

A Quick Note on the Rent Control Amendment Debate

[From here.]

Despite the apparent fury on display at City Hall this week, my take on the debate over rent control amendments is pretty straightforward. Almost all of the changes are minor and there's not that much disagreement at the City Council level. It seems unfortunate to me that affordable housing advocates have been whipped up into a seeming fury over minor policy changes, most (or all?) of which will end up helping the city’s renters.

For example:

There’s unanimous (?) support for a new construction exemption of some length, and for good reason.* I don’t know enough about the inner workings of housing financing to be able to tell you whether 15 or 20 years would be more effective rolling window -- only bankers and developers would know the answer to that -- but I can tell you that difference between a 15- or 20-year window is small potatoes and will not trigger an avalanche of displacement. Given the wide gulf between housing markets in St. Paul and California (where extreme prices make new construction displacement into a problem), I think the concerns of advocates about the new construction exemption are seriously overblown. 

The "rent banking" proposed by Council Member Tolbert is even more of a no brainer, and leaves me seriously scratching my head as to why the Housing Justice Center is opposing it. For one thing, this policy is not vacancy decontrol, and should never have been given that moniker. "Vacancy decontrol" implies that when a tenant moves out, rents would go up past a theoretical 3% annual cap. This policy doesn’t allow that to happen; rents would remain capped at a 3% annual increase. (I.e., rent increases could not exceed 9% over a three-year timeframe, etc.)

All this does is remove the “use it or lose it” incentive from the current policy, which is a problem with the rules currently on the books. Right now, both anecdotally and in the rental data, many of the city’s landlords are automatically increasing rents at 3% a year for all their units, no matter the context.  That’s likely why, for the first time ever, average St. Paul rents have risen faster than those in neighboring, more wealthy Minneapolis.

Council Member Tolbert's banking provision simply removes that incentive, making it much more likely that landlords will keep rents flat for their existing tenants. If you care about renter stability, that’s a good thing! 

Finally, the debate over whether or not to exempt Federally subsidized and regulated apartments seems weird to me. At first glance, it’s doesn't seem legal? We’re talking about rents that are already regulated and controlled by Federal policy. It will surely end in a lawsuit, so that's good for the lawyers, I guess... At second glance, isn’t it possible this decreases subsidized housing production in St. Paul? 

But basically, all the proposals I've seen, with the notable exception of Council Member Prince’s vacancy decontrol amendment, are benign tweaks that leave the bulk of the city’s rent control policy in place. 

(Personally, I don't think these proposals go far enough, and won’t fix the structural problems with the existing ordinance, but that's a story for another day. I already wrote 4,000 words detailing my prescription for that. I'm glad that Council Member Prince is introducing actual vacancy decontrol, which I believe is the most effective and simplest way to fix the city’s policy.)

In short, having some sort of new construction exemption in the policy is a must. Given the deep need for the city to attract investment in housing, I would prefer to see the City Council erring on the side of caution and going with 20 years. But in general, it’s good that a Council majority is on board with some sort of exemption! 

The rest of the changes, with the exception of Council Member Prince’s amendment, seem pretty minor. I guess I’m disappointed that these small tweaks have become so politicized, because the Tolbert amendments are benign changes that should be widely embraced by city leaders. 


* The city housing data on display from Department of Safety and Inspections (DSI) at the meeting sure seems fishy, and I’d be willing to bet a good sum of money that it is incorrect. I’m digging into why that table contradicts the numbers from HUD, and will be sure to clarify this when I can. Unless there’s some error in recent reporting from the city, the broad trends in the HUD dataset, which covers every city and county in the country, are likely to be correct, so I’m guessing the problem lies in the city statistics. No offense to the hard-working folks at DSI, but they are not exactly known for their data analysis acumen.